US Banking Transactions
Customer Spending Behaviours - Data Analysis - Data Visualizations
The Project Overview
This project analyzes over 5,400 US banking transactions from 2023–2024 to uncover customer spending behaviour, payment preferences, merchant performance, and the impact of discounts. The goal was to extract actionable insights that financial institutions could use to improve marketing strategies, optimize operations, and tailor services to customer needs.

My Role
I acted as both a Product Designer and Data Analyst, bridging
design thinking with data science. My role was to identify patterns in customer behaviour, visualize findings, and provide strategic recommendations for how banks and fintech companies could leverage these insights for decision-making.
Tools and Methods
Data Preparation & Cleaning: Python (Pandas, NumPy)
Exploratory Analysis: Python (Matplotlib, Seaborn)
Big Data Processing: Hadoop ecosystem (Hive, Pig)
Visualization & Dashboards: Tableau
Statistical Testing: Welch’s t-test
The Dataset
Size: 5,400+ transactions, 22 attributes
Key Fields: transaction_amount, customer_age, occupation, payment_method, merchant_category, city, discount_applied
Preparation Highlights:
Standardized date/time formats
Normalized categorical fields
Verified and restored tables
Reformatted boolean-like fields

The Problem Statement
Banks generate vast amounts of transaction data but often struggle to translate it into clear business insights. Key questions driving this analysis included:
Which age groups and occupations contribute most
to revenue?How do different demographics prefer to pay?
Which merchant categories and cities bring in the
highest value?Are discount strategies effective in driving larger transactions?

The Approach for Data Analysis
Cleaned and structured the dataset for analysis.
Conducted Exploratory Data Analysis (EDA) to identify spending patterns and anomalies.
Built visual dashboards in Tableau to answer the business questions.
Interpreted insights and translated them into strategic recommendations for banking and fintech stakeholders.
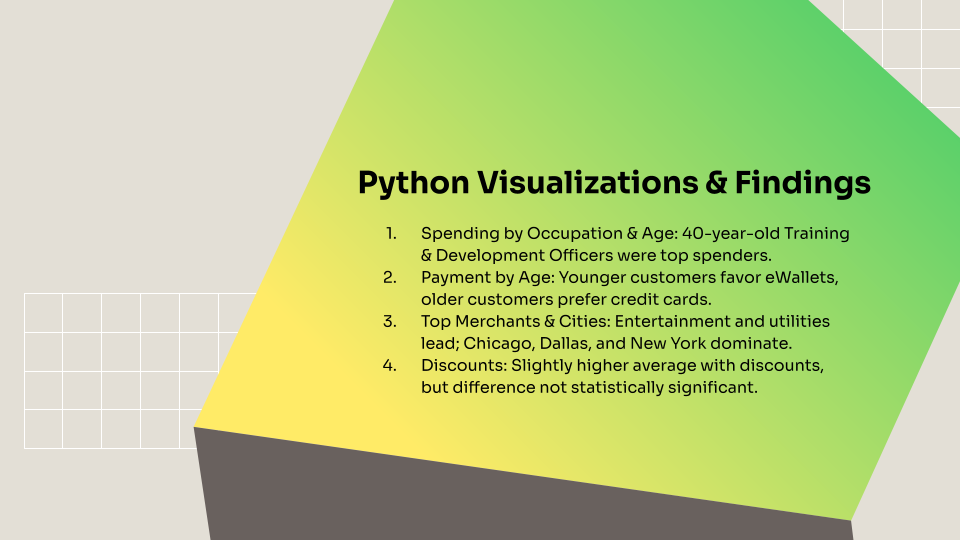


Tableau Visualizations Overview
Top occupations by spending per age group
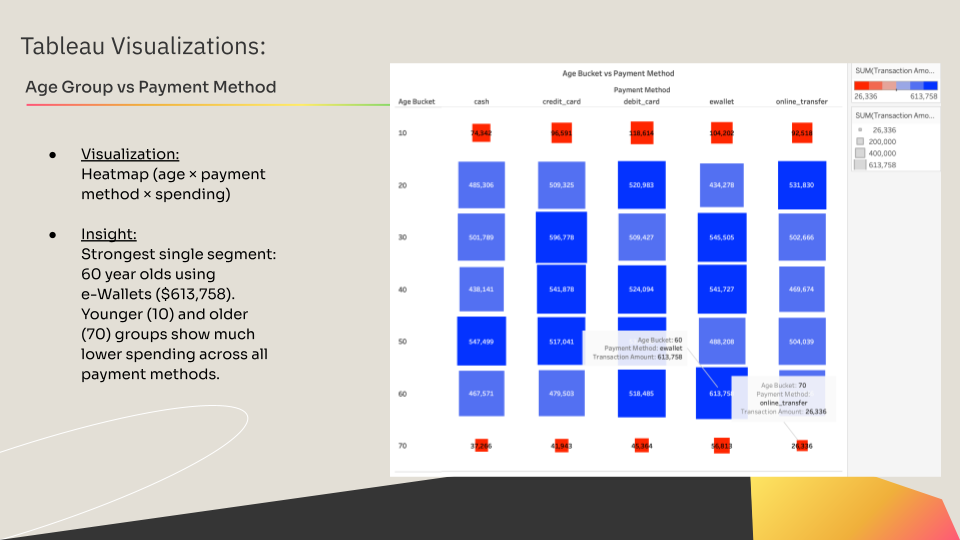
Payment method share by age group
Top merchant categories & cities
Discounts vs. no discounts


Key Findings
Demographics: Training & Development Officers in their 40s were the highest-spending group ($28,357).
Payment Preferences: Younger customers preferred eWallets, while older customers leaned toward credit cards.
Merchant and City Performance: Entertainment and Utilities led revenue; Chicago, Dallas, and New York were top cities.
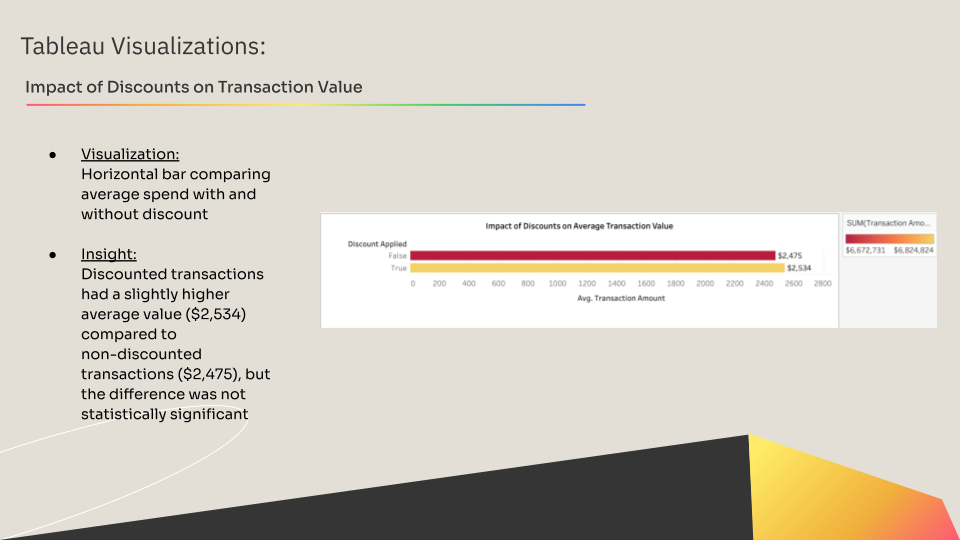
Discounts: Transactions with discounts averaged $2,534 vs $2,475 without discounts, but the difference was not statistically significant.
Recommendations
Prioritize marketing campaigns for high-spending professions and age groups.
Promote payment method partnerships. For example: eWallet promos for younger users.
Focus operational resources on top-performing categories and cities.
Reassess the effectiveness of discount strategies.
Plan campaigns around seasonal spending peaks.

Final Thoughts
This analysis highlighted how transaction data can be transformed into strategic insights for banks and fintechs. By understanding spending behaviours, payment preferences, and merchant performance, financial institutions can refine customer engagement, reduce inefficiencies, and design services that are more human centred and data driven.
Next Steps
The project opens opportunities to:
Apply predictive analytics to forecast customer lifetime value.
Develop personalized financial recommendations based on behavioural patterns.
Explore geographic and demographic segmentation for hyper localized campaigns.
Scale findings into a dashboard system that supports real time decision making across marketing, operations, and customer service teams.